 懸垂線の弛みの計算については、懸垂線の方を参照して下さい。
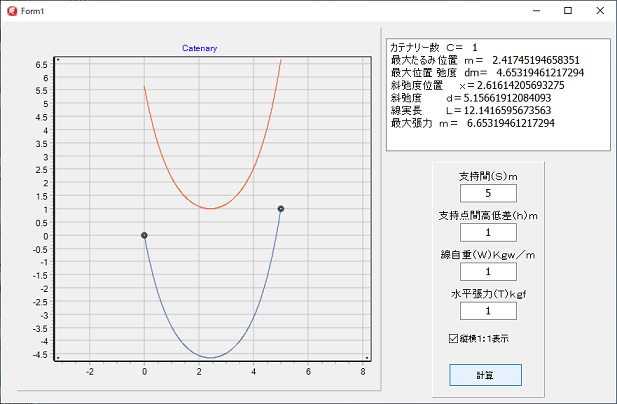
最下点を中心に右と左では張力の方向が変わりますが、グラフは単に張力として表しています。
支持点に高さの差があり、水平張力が大きい場合最下点が支持点の外側の仮想最下点となります。
懸垂線の張力
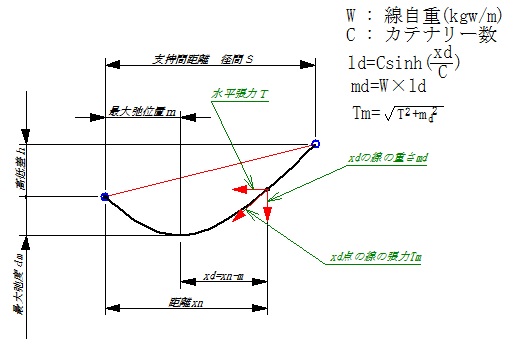
懸垂線の張力は、簡単で、水平張力と、懸垂線の一番低い位置から張力計算指定点迄の線の自重の合成力となります。
その方向は、当然、その点の線の方向となります。
 懸垂線の弛みの計算については、懸垂線の方を参照して下さい。
最下点を中心に右と左では張力の方向が変わりますが、グラフは単に張力として表しています。
支持点に高さの差があり、水平張力が大きい場合最下点が支持点の外側の仮想最下点となります。
 カテナリー数が1の場合、張力の曲線は、カテナリー曲線に一致します。
赤い線が張力です。
プログラム
unit Main;

interface

uses
  Winapi.Windows, Winapi.Messages, System.SysUtils, System.Variants, System.Classes, Vcl.Graphics,
  Vcl.Controls, Vcl.Forms, Vcl.Dialogs, Vcl.StdCtrls, Vcl.ExtCtrls,
  VclTee.TeeGDIPlus, VCLTee.TeEngine, VCLTee.Series, VCLTee.TeeProcs,
  VCLTee.Chart;

type
  TForm1 = class(TForm)
    Memo1: TMemo;
    Panel1: TPanel;
    W_Edit: TLabeledEdit;
    h_Edit: TLabeledEdit;
    T_Edit: TLabeledEdit;
    S_Edit: TLabeledEdit;
    Chart1: TChart;
    Series1: TLineSeries;
    Series2: TPointSeries;
    Button1: TButton;
    CheckBox1: TCheckBox;
    Series3: TLineSeries;
    Series4: TPointSeries;
    procedure Button1Click(Sender: TObject);
  private
    { Private 宣言 }
    function datainput: boolean;
    procedure Drawing;
    procedure tension;
  public
    { Public 宣言 }
  end;

var
  Form1: TForm1;

implementation

{$R *.dfm}
uses
  system.Math;

var
  S : double;     // 支持間 m
  h : double;     // 高低差 m
  W : double;     // 線自重 kgw/m
  T : double;     // 線張力 kgf
  C : double;     // カテナリー数
  d : double;     // 弛度   m
  m : double;     // 最大たるみ位置 m
  dm :double;     // 最大たるみ位置 弛度  m
  x : double;     // 斜弛度地点までの距離 m
  L : double;     // 線実長

// 入力処理
function TForm1.datainput: boolean;
var
  ch: integer;
begin
  S := 0;
  result := false;
  val(S_edit.Text, S, ch);
  if (ch <> 0) or (S <= 0) then begin
    application.MessageBox('支持間距離に間違いがあります。','注意',0);
    exit;
  end;
  val(h_edit.Text, h, ch);
  if ch <> 0 then begin
    application.MessageBox('高低差に間違いがあります。','注意',0);
    exit;
  end;
  val(W_edit.Text, W, ch);
  if ch <> 0 then begin
    application.MessageBox('線自重に間違いがあります。','注意',0);
    exit;
  end;
  if W <= 0 then begin
    application.MessageBox('線自重はゼロ以上にして下さい。','注意',0);
    exit;
  end;
  val(T_edit.Text, T, ch);
  if ch <> 0 then begin
    application.MessageBox('線張力に間違いがあります。','注意',0);
    exit;
  end;
  if T <= 0 then begin
    application.MessageBox('線張力はゼロ以上にして下さい。','注意',0);
    exit;
  end;
  result := true;
end;

// 懸垂線作図
// 低い方の支持位置基準
procedure TForm1.Drawing;
var
  xn  : double;
  x, dx : double;
  y   : double;
  i   : integer;
begin
  dx := S / 500;
  // 懸垂線作図
  for i := 0 to 500 do begin
    xn := i * dx;                     // 計算位置
    x := abs(xn - m);                 // 最大弛み位置からの距離
    y := C * (cosh(x / C) - 1) - dm;  // 高さ 低い方の支持位置を基準として計算
    Series1.AddXY(xn, y);
  end;
  // 支持位置 丸表示
  Series4.AddXY(0, 0);                // 低い方の支持位置
  Series4.AddXY(S, h);                // 高い方の支持位置
end;

// 張力グラフ
procedure TForm1.tension;
var
  xn    : double;
  x, dx : double;
  ld    : double;
  i     : integer;
  md, Tm: double;
begin
  dx := S / 500;
  // 懸垂線作図
  for i := 0 to 500 do begin
    xn := i * dx;                     // 計算位置
    x := abs(xn - m);                 // 最大弛み位置からの距離
    ld := C * sinh(x / C);            // 最大弛み位置からの長さ
    md := ld * W;                     // 線の重さ
    Tm := sqrt(md * md + T * T);      // 張力との合力計算
    Series3.AddXY(xn, Tm);
  end;
end;

// 懸垂線計算の実行
procedure TForm1.Button1Click(Sender: TObject);
var
  s1  : double;
  lmin, lmax  : double;
  bmin, bmax  : double;
  mg          : double;
  xd, ld      : double;
  md          : double;
  Tm          : double;
  ys          : double;
begin
  if not datainput then exit;
  memo1.Clear;
  C := T / W;
  memo1.Lines.Add('カテナリー数 C= ' + floatTostr(C));
  m := S / 2 - C * arcsinh(h / (2 * C * sinh(S / 2 / C)));
  memo1.Lines.Add('最大たるみ位置 m= ' + floatTostr(m));
  s1 := abs(m * 2);
  dm := C * (cosh(s1 / 2 / C) - 1);
  memo1.Lines.Add('最大位置 弛度 dm= ' + floatTostr(dm));
  x := m + C * arcsinh(h / S);
  memo1.Lines.Add('斜弛度位置   x=' + floatTostr(x));
  d := x / S * h + C * (cosh(m / C) - cosh(arcsinh(h / S)));
  memo1.Lines.Add('斜弛度    d=' + floatTostr(d));
  L := C * (sinh(m / C) + sinh((S - m) / C));
  memo1.Lines.Add('線実長    L=' + floatTostr(L));
  if h > 0 then xd := abs(S - m)                       // 高い方の支持位置の張力計算
           else xd := abs(0 - m);
  ld := C * sinh(xd / C);                  // 線の長さ
  md := ld * W;                                         // 線の重さ
  Tm := sqrt(md * md + T * T);                               // 張力
  memo1.Lines.Add('最大張力 m= ' + floatTostr(Tm));
  // グラフスケール計算
  if h / S * x - d < 0 then ys := d - h / S * x
                       else ys := 0;
  if (m > 0) and (m < S) then
    if dm > ys then ys := dm;
  lmin := -ys;
  if lmin > h then lmin := h;
  if h < 0 then lmax := 0
           else lmax := h;
  if tm > lmax then lmax := tm;
  bmin := 0;
  bmax := S;
  // グラフ縦横スケール設定
  if bmax > lmax - lmin then begin
    mg := (bmax - (lmax - lmin)) / 2;
    lmax := lmax + mg;
    lmin := lmin - mg;
  end
  else begin
    mg := ((lmax - lmin) - bmax) / 2;
    bmin := bmin - mg;
    bmax := bmax + mg;
  end;
  Series1.Clear;
  Series2.Clear;
  Series3.Clear;
  Series4.Clear;
  if checkbox1.Checked then begin
    Series2.AddXY(bmin, lmax);
    Series2.AddXY(bmin, lmin);
    Series2.AddXY(bmax, lmin);
  end;
  application.ProcessMessages;
  Drawing;
  tension;
end;

end.