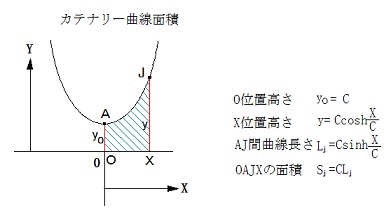
 懸垂線の面積は、カテナリー数Cと長さLの積になります。
詳細についてはインターネットで検索してください。
面積計算の場合は、y方向値の一番小さい場所の値は、カテナリー数Cの値となります。
カテナリー曲線の長さは、曲線上の任意の点から任意の点への長さで、場所は問いません。
懸垂線の面積
懸垂線の面積を求めます。
 懸垂線の面積は、カテナリー数Cと長さLの積になります。
詳細についてはインターネットで検索してください。
面積計算の場合は、y方向値の一番小さい場所の値は、カテナリー数Cの値となります。
カテナリー曲線の長さは、曲線上の任意の点から任意の点への長さで、場所は問いません。
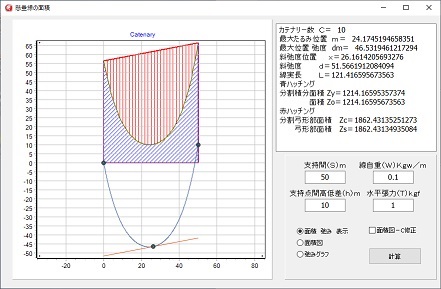
次のグラフは、懸垂線の弛みのグラフを利用しているので、X方向方向原点の位置が、左側の支持点位置となっています。
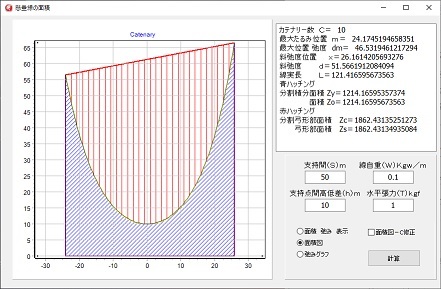
面積図単独の場合は、カテナリー曲線の原点(最大弛み位置)がゼロの位置となります。
カテナリー数が大きい場合、面積図が縦に細長くなってしまいます、その時は、面積図-C補正にチェックを入れると、C×S長方形の部分を取り除いてグラフを表示しますが、面積計算には影響しません。
単に図の表示変更です。


弓形部の面積は、四角形の面積から、カテナリー数と長さの積で計算した面積を減算して求めています。
面積の値が正しいかどうかは、微小間隔に分割して積分した値と比べて確認をとっています。
プログラム
unit Main;

interface

uses
  Winapi.Windows, Winapi.Messages, System.SysUtils, System.Variants, System.Classes, Vcl.Graphics,
  Vcl.Controls, Vcl.Forms, Vcl.Dialogs, Vcl.StdCtrls, Vcl.ExtCtrls,
  VclTee.TeeGDIPlus, VCLTee.TeEngine, VCLTee.Series, VCLTee.TeeProcs,
  VCLTee.Chart;

type
  TForm1 = class(TForm)
    Memo1: TMemo;
    Panel1: TPanel;
    W_Edit: TLabeledEdit;
    h_Edit: TLabeledEdit;
    T_Edit: TLabeledEdit;
    S_Edit: TLabeledEdit;
    Chart1: TChart;
    Series1: TLineSeries;
    Series2: TPointSeries;
    Button1: TButton;
    Series3: TLineSeries;
    Series4: TPointSeries;
    Series5: TLineSeries;
    Image1: TImage;
    RadioButton1: TRadioButton;
    RadioButton2: TRadioButton;
    RadioButton3: TRadioButton;
    procedure Button1Click(Sender: TObject);
    procedure FormCreate(Sender: TObject);
  private
    { Private 宣言 }
    function datainput: boolean;
    procedure Drawing;
    function area: double;
    procedure ImageClear;
    procedure areaDraw(i: integer; x, y: double);
    procedure areaLine;
  public
    { Public 宣言 }
  end;

var
  Form1: TForm1;

implementation

{$R *.dfm}
uses
  system.Math;

const
  K = 20000;        // 分割積分 分割数
  J = 100;          // イメージ作図分割数

var
  S : double;       // 支持間 m
  h : double;       // 高低差 m
  W : double;       // 線自重 kgw/m
  T : double;       // 線張力 kgf
  C : double;       // カテナリー数
  d : double;       // 弛度   m
  m : double;       // 最大たるみ位置 m
  dm :double;       // 最大たるみ位置 弛度  m
  x : double;       // 斜弛度地点までの距離 m
  L : double;       // 線実長
  xs, ys    : double;       // imageスケール
  xsb, ysb  : double;       // グラフ基準位置
  xbase, ybase : integer;   // イメージ基準位置

// 入力処理
function TForm1.datainput: boolean;
var
  ch: integer;
begin
  S := 0;
  W := 0;
  T := 0;
  result := false;
  val(S_edit.Text, S, ch);
  if (ch <> 0) or (S <= 0) then begin
    application.MessageBox('支持間距離に間違いがあります。','注意',0);
    exit;
  end;
  val(h_edit.Text, h, ch);
  if ch <> 0 then begin
    application.MessageBox('高低差に間違いがあります。','注意',0);
    exit;
  end;
  val(W_edit.Text, W, ch);
  if (ch <> 0) or (W <= 0) then begin
    application.MessageBox('線自重に間違いがあります。','注意',0);
    exit;
  end;
  val(T_edit.Text, T, ch);
  if (ch <> 0) or (T <= 0) then begin
    application.MessageBox('線張力に間違いがあります。','注意',0);
    exit;
  end;
  result := true;
end;

// 面積計算部枠線とハッチング
procedure TForm1.areaLine;
const
  KM = 30;
var
  x, y: double;
  xpos, ypos: integer;
  i : integer;
  xn, dx : double;
  hy, dh : double;
begin
  // 支持点間線引
  Image1.Canvas.Pen.Color := ClRed;
  x := Series5.XValues.Items[0];
  y := Series5.YValues.Items[0];
  areaDraw(0, x, y);              // Moveto
  x := Series5.XValues.Items[J];
  y := Series5.YValues.Items[J];
  areaDraw(1, x, y);              // Lineto
  // 積分範囲枠線引
  y := 0;
  Image1.Canvas.Pen.Color := clPurple;
  areaDraw(1, x, y);              // Lineto
  if Radiobutton2.Checked then
    x := -m
  else
    x := 0;
  areaDraw(1, x, y);
  x := Series5.XValues.Items[0];
  y := Series5.YValues.Items[0];
  areaDraw(1, x, y);              // Lineto
  // 弓型部
  Image1.Canvas.Pen.Color := ClRed;
  Image1.Canvas.Pen.Width := 1;
  dh := h / S;
  dx := S / KM;
  // 弓形部ハッチング
  for i := 1 to KM -1 do begin
    xn := i * dx;                     // 計算位置
    x := abs(xn - m);                 // 最大弛み位置からの距離
    if Checkbox1.Checked then
      y := C * (cosh(x / C) - 1)      // 高さ
    else
      y := C * (cosh(x / C));         // 高さ
    if xn > m then
      x := x + m
    else
      x := m - x;
    if Radiobutton2.Checked then x := x - m;
    areaDraw(0, x, y);                // Moveto
    if Checkbox1.Checked then
      hy := dh * xn + dm
    else
      hy := dh * xn + dm + C;
    areaDraw(1, x, hy);               // Lineto
  end;
  // 積分範囲ハッチング
  if d / S > 5 then exit;
  Image1.Canvas.brush.Color := Clblue;
  Image1.Canvas.brush.Style := bsBDiagonal;
  if Radiobutton2.Checked then
    xpos := round((-m - xsb) * xs) + xbase + 3
  else
    xpos := round((0 - xsb) * xs) + xbase + 3;
  ypos := round((0 - ysb) * ys) + ybase - 3;
  if not Checkbox1.Checked then
    Image1.Canvas.FloodFill(xpos, ypos, clwhite, fsSurface);
end;

// カテナリー線作図Sub
procedure TForm1.areaDraw(i: integer; x, y: double);
var
  xpos, ypos: integer;
begin
  xpos := round((x - xsb) * xs) + xbase;
  ypos := round((y - ysb) * ys) + ybase;
  if i = 0 then Image1.Canvas.MoveTo(xpos, ypos)
           else Image1.Canvas.LineTo(xpos, ypos);
end;

// 面積計算グラフ作図
function TForm1.area: double;
var
  xn  : double;
  x, dx : double;
  y, hy : double;
  i   : integer;
  Z   : double;
  Zs  : double;
  Zo  : double;
  dh  : double;
  Zc  : double;
begin
  Image1.Canvas.Pen.Color := clYellow;
  Image1.Canvas.Pen.Style := psSolid;
  Image1.Canvas.Pen.Width := 2;
  dx := S / K;                        // 積分用分割値
  Z := 0;
  // カテナリー分割積分
  for i := 0 to K - 1 do begin
    xn := (i + 0.5) * dx;                     // 計算位置
    x := abs(xn - m);                 // 最大弛み位置からの距離
    y := C * cosh(x / C);             // 高さ カテナリー線基準の高さ
    Z := Z + dx * y;
  end;
  memo1.Lines.Add('青ハッチング');
  memo1.Lines.Add('分割積分面積 Zy=' + floatTostr(Z));
  Zo := L * C;
  memo1.Lines.Add('      面積 Zo=' + floatTostr(L * C));
  Zs := ((C + dm) + (C + dm + h)) * S / 2 - Zo;
  dh := h / S;
  Zc := 0;
  // 分割弓型部面積計算
  for i := 0 to K - 1 do begin
    xn := (i + 0.5) * dx;                     // 計算位置
    x := abs(xn - m);                 // 最大弛み位置からの距離
    y := C * (cosh(x / C) - 1) - dm;  // 高さ 低い方の支持位置を基準として計算
    hy := dh * xn;
    Zc := Zc + (hy - y) * dx;
  end;
  memo1.Lines.Add('赤ハッチング');
  memo1.Lines.Add('分割弓形部面積  Zc=' + floatTostr(Zc));
  memo1.Lines.Add('    弓形部面積  Zs=' + floatTostr(Zs));
  // カテナリー線作図
  dx := S / J;                        // 作図用分割値
  for i := 0 to J do begin
    xn := i * dx;                     // 計算位置
    x := abs(xn - m);                 // 最大弛み位置からの距離
    if Checkbox1.Checked then
      y := C * (cosh(x / C) - 1)      // 高さ カテナリー線基準の高
    else
      y := C * (cosh(x / C));         // 高さ カテナリー線基準の高さ
    x := xn -m;
    if Radiobutton2.Checked then begin
      Series5.AddXY(x, y);
      areaDraw(i, x, y);              // イメージ作図
    end
    else begin
      Series5.AddXY(xn, y);
      areaDraw(i, xn, y);             // イメージ作図
    end;
  end;
  areaLine;
  Chart1.BackImage.Bitmap := Image1.Picture.Bitmap;
  result := Zs;                       // 戻り値弓型部面積
end;

// 懸垂線作図
// 低い方の支持位置基準
procedure TForm1.Drawing;
const
  K = 500;
var
  xn  : double;
  x, dx : double;
  y   : double;
  i   : integer;
begin
  dx := S / K;
  // 懸垂線作図
  for i := 0 to K do begin
    xn := i * dx;                     // 計算位置
    x := abs(xn - m);                 // 最大弛み位置からの距離
    y := C * (cosh(x / C) - 1) - dm;  // 高さ 低い方の支持位置を基準として計算
    Series1.AddXY(xn, y);
  end;
  // 斜弛み位置通過接線
  Series3.AddXY(0, 0 - d);            // 斜弛み位置通過傾斜線 低い方
  Series3.AddXY(S, h - d);            // 斜弛み位置通過傾斜線 高い方
  // 支持位置 斜弛度地点 丸表示
  Series4.AddXY(0, 0);                // 低い方の支持位置
  x := m + C * arcsinh(h / S);        // 斜弛度地点距離 x
  y := h / S * x - d;                 // 斜弛度y座標
  Series4.AddXY(x, y);                // 斜弛度xy
  Series4.AddXY(S, h);                // 高い方の支持位置
end;

// 懸垂線計算の実行
procedure TForm1.Button1Click(Sender: TObject);
var
  s1  : double;
  lmin, lmax  : double;
  bmin, bmax  : double;
  mg          : double;
  x0, y0      : double;
begin
  if not datainput then exit;
  button1.Enabled := False;
  memo1.Clear;
  application.ProcessMessages;
  C := T / W;
  memo1.Lines.Add('カテナリー数 C= ' + floatTostr(C));
  m := S / 2 - C * arcsinh(h / (2 * C * sinh(S / 2 / C)));
  memo1.Lines.Add('最大たるみ位置 m= ' + floatTostr(m));
  s1 := abs(m * 2);
  dm := C * (cosh(s1 / 2 / C) - 1);
  memo1.Lines.Add('最大位置 弛度 dm= ' + floatTostr(dm));
  x := m + C * arcsinh(h / S);
  memo1.Lines.Add('斜弛度位置   x=' + floatTostr(x));
  d := x / S * h + C * (cosh(m / C) - cosh(arcsinh(h / S)));
  memo1.Lines.Add('斜弛度    d=' + floatTostr(d));
  L := C * (sinh(m / C) + sinh((S - m) / C));
  memo1.Lines.Add('線実長    L=' + floatTostr(L));
  // グラフスケール計算高さ
  if h < 0 then begin                 // 支持点右側が低い場合
    lmin := h - d;
    lmax := 0;
  end
  else begin                          // 支持点右側が高い場合
    lmin := 0 - d;
    lmax := h;
  end;
  // 面積表示部分のグラフ高さ計算
  if Radiobutton1.Checked or Radiobutton2.Checked then begin
    x0 := abs(m);                       // 最大弛み位置からの距離
    if Checkbox1.Checked then
      y0 := C * (cosh(x0 / C) - 1)      // 高さ
    else
      y0 := C * (cosh(x0 / C));         // 高さ
    if h > 0 then y0 := y0 + h;         // 高さ 低い方の支持位置を基準として計算
    if y0 > lmax then lmax := y0;
  end;
  // グラフスケール計算幅
  if Radiobutton2.Checked then begin
    Lmin := 0;
    bmin := -m;
    bmax := S - m;
  end
  else begin
    bmin := 0;
    bmax := S;
  end;
  // グラフ縦横スケール設定
  if bmax -bmin > lmax - lmin then begin
    mg := ((bmax - bmin) - (lmax - lmin)) / 2;
    lmax := lmax + mg;
    lmin := lmin - mg;
  end
  else begin
    mg := ((lmax - lmin) - (bmax - bmin)) / 2;
    bmin := bmin - mg;
    bmax := bmax + mg;
  end;
  Series1.Clear;
  Series2.Clear;
  Series3.Clear;
  Series4.Clear;
  Series5.Clear;
  application.ProcessMessages;
  with Series2 do begin
    AddXY(bmin, lmax);
    AddXY(bmin, lmin);
    AddXY(bmax, lmin);
    application.ProcessMessages;
    xbase := CalcXPos(1);
    ybase := CalcYPos(1);
    // Image作図用係数設定
    xsb := XValues.Items[2] - XValues.Items[1];
    xs := (CalcXPos(2) - CalcXPos(1)) / xsb;
    xsb := XValues.Items[1];
    ysb := YValues.Items[0] - YValues.Items[1];
    ys :=  (CalcYpos(0) - CalcYpos(1)) / ysb;
    ysb := YValues.Items[1];
  end;
  ImageClear;
  Chart1.BackImage.Bitmap := Image1.Picture.Bitmap;
  application.ProcessMessages;
  if Radiobutton1.Checked then begin
    Drawing;
    area;
  end;
  if Radiobutton2.Checked then area;
  if Radiobutton3.Checked then Drawing;
  button1.Enabled := True;
end;

procedure TForm1.ImageClear;
begin
  Image1.Canvas.Brush.Style := bsSolid;
  Image1.Canvas.Brush.Color := Clwhite;
  Image1.Canvas.FillRect(rect(0, 0, Image1. Width, Image1. Height));
  Image1.Canvas.Brush.Style := bsClear;
  Chart1.BackImage.Bitmap := Image1.Picture.Bitmap;
end;

procedure TForm1.FormCreate(Sender: TObject);
var
  bm : Tbitmap;
begin
  bm := Tbitmap.Create;
  bm.Width := Chart1.Width;
  bm.Height := Chart1.Height;
  Image1.Width := Chart1.Width;
  Image1.Height := Chart1.Height;
  Image1.Picture.Bitmap := bm;
  Image1.Canvas.Brush.Color := clWhite;
  Image1.Visible := False;
  bm.Free;
  ImageClear;
end;

end.