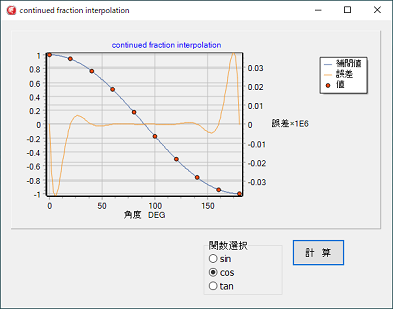
 左図は三角関数の中間値を連分数で補間計算しその時の誤差をグラフにしたものですが、小さな誤差となっています。
三角関数の場合、その範囲が180°程度で有れば良くフィッテングします。
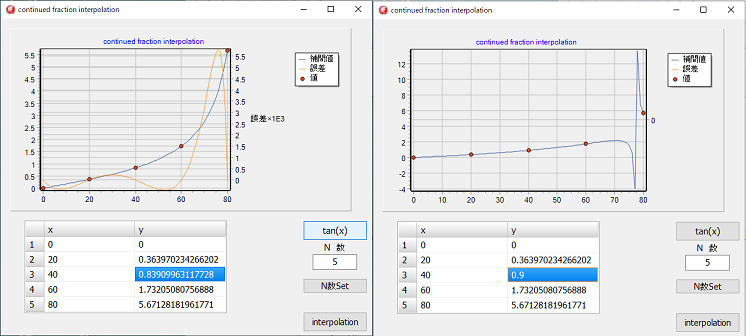
tan(x)に関しては、90度で無限大となる為、90°近辺に対しては無理が有ります。
連分数補間
xとyの独立変数で表されるカーブの値を連分数でフィッテングします。
xの値は連続して同じ値が有ってはなりません、又、直線となる三点の値があると、補間係数計算式の分母がゼロになり計算できません。
その場合、僅かに値をずらすことにより計算は可能となります。
左図は三角関数の中間値を連分数で補間計算しその時の誤差をグラフにしたものですが、小さな誤差となっています。
三角関数の場合、その範囲が180°程度で有れば良くフィッテングします。
tan(x)に関しては、90度で無限大となる為、90°近辺に対しては無理が有ります。
三角関数や対数のような関数に近い値のカーブの場合は、よくフィッテングしますが、そこから外れた場合に対しての余裕度は小さいようです。
逆に、連分数補間でフィッテングする場合は、何らかの関数に従った値と言えるでしょう。
プログラム 上図上
unit Main;

interface

uses
  Winapi.Windows, Winapi.Messages, System.SysUtils, System.Variants, System.Classes, Vcl.Graphics,
  Vcl.Controls, Vcl.Forms, Vcl.Dialogs, VclTee.TeeGDIPlus, Vcl.StdCtrls,
  VCLTee.TeEngine, VCLTee.Series, Vcl.ExtCtrls, VCLTee.TeeProcs, VCLTee.Chart;

type
  TForm1 = class(TForm)
    Chart1: TChart;
    Series1: TLineSeries;
    Button1: TButton;
    Series2: TLineSeries;
    Series3: TPointSeries;
    RadioGroup1: TRadioGroup;
    procedure Button1Click(Sender: TObject);
  private
    { Private 宣言 }
  public
    { Public 宣言 }
  end;

var
  Form1: TForm1;

implementation

{$R *.dfm}
uses system.Math;

type
  DArray = array of double;

// 係数表計算
procedure maketable(x, y : DArray; N: integer);    // 係数を求めy[]に上書き
var
  i, j : integer;
begin
  for j := 0 to N - 1 do
    for i := j + 1 to N - 1 do begin
      if y[i] - y[j] = 0 then begin
        application.MessageBox(pchar('y' + inttostr(i+1) + '-y' + inttostr(j+1)
                                         + 'がゼロになります。'),'注意',0);
        exit;
      end;
      y[i] := (x[i] - x[j]) / (y[i] - y[j]);
    end;
end;

// 連分数による補間計算
function interpolate(x, y: DArray; N: integer; t: double): double;  // 補間
var
  i : integer;
  r : double;
begin
  r := y[N - 1];
  for i := N - 2 downto 0 do
    r := (t - x[i]) / r + y[i];
  result := r;
end;

// 補間計算グラフ作図
procedure TForm1.Button1Click(Sender: TObject);
const
  PITCH = 20;
var
  N : integer;
  i, imax : integer;
  s, t, e, es : double;
  x, y : Darray;                     // array of double
begin
  N := 5;                            // 0~80°
  t := 0;
  es := 1;
  case RadioGroup1.ItemIndex of
    0: N := 19;                      // 0~360°
    1: N := 10;                      // 0~180°
//    2: N := 5;                       // 0~80°
  end;
  setlength(x, N);
  setlength(y, N);
  Series1.Clear;
  Series2.Clear;
  Series3.Clear;
  for i := 0 to N - 1 do begin
    x[i] := PITCH * i;
    case RadioGroup1.ItemIndex of
      0: y[i] := sin(x[i] * pi / 180);
      1: y[i] := cos(x[i] * pi / 180);
      2: y[i] := tan(x[i] * pi / 180);
    end;
    Series3.AddXY(x[i], y[i]);
  end;
  maketable(x, y, N);                   // 表の作成
  case RadioGroup1.ItemIndex of
    0:  begin
          es := 1e6;
          chart1.RightAxis.Title.Text := '誤差×1E6';
        end;
    1:  begin
          es := 1e6;
          chart1.RightAxis.Title.Text := '誤差×1E6';
        end;
    2:  begin
          es := 1e3;
          chart1.RightAxis.Title.Text := '誤差×1E3';
        end;
  end;
  imax := (N - 1) * PITCH;
  for i := 0 to imax do begin           // グラフ作図
    case RadioGroup1.ItemIndex of
      0: t := sin(i * pi / 180);
      1: t := cos(i * pi / 180);
      2: t := tan(i * pi / 180);
    end;
    s := interpolate(x, y, N, i);       // 補間計算
    Series1.AddXY(i, s);
    e := (s - t) * es;                  // 誤差
    Series2.AddXY(i, e);
  end;
end;

end.
プログラム 上図下 stringgridで、自由なx,yの値を入力出来るようにしたものです。
サンプルとして、tan(x)の値が表示されます。
unit Main;

interface

uses
  Winapi.Windows, Winapi.Messages, System.SysUtils, System.Variants, System.Classes, Vcl.Graphics,
  Vcl.Controls, Vcl.Forms, Vcl.Dialogs, VclTee.TeeGDIPlus, Vcl.StdCtrls,
  VCLTee.TeEngine, VCLTee.Series, Vcl.ExtCtrls, VCLTee.TeeProcs, VCLTee.Chart,
  Vcl.Grids;

type
  TForm1 = class(TForm)
    Chart1: TChart;
    Series1: TLineSeries;
    tanxBtn: TButton;
    Series2: TLineSeries;
    Series3: TPointSeries;
    StringGrid1: TStringGrid;
    NEdit: TLabeledEdit;
    NsetBtn: TButton;
    interpolationBtn: TButton;
    procedure tanxBtnClick(Sender: TObject);
    procedure NsetBtnClick(Sender: TObject);
    procedure interpolationBtnClick(Sender: TObject);
    procedure FormCreate(Sender: TObject);
  private
    { Private 宣言 }
    procedure GridSet(Sin, Colin: integer);
    procedure FGridSet(Sin, Colin: integer);    // グリッドサイズ変更
  public
    { Public 宣言 }
  end;

var
  Form1: TForm1;

implementation

{$R *.dfm}
uses system.Math;

type
  DArray = array of double;

// グリッドサイズの変更
procedure TForm1.GridSet(Sin, Colin: integer);    // グリッドサイズ変更
var                                               // データー行の数は10迄
  H, W:integer;                                // それ以上はスクロールする
begin
  if (StringGrid1.ColCount = Colin) and (StringGrid1.RowCount = Sin) then exit;
  StringGrid1.ColWidths[0] := 30;
  StringGrid1.ColCount := Colin;
  StringGrid1.RowCount := Sin;
  if Sin <= 11 then                               // ストリンググリッドの大きさ設定
    begin                                         // 固定行を含め11行又はそれ以下の場合
      H := (StringGrid1.DefaultRowHeight + 1) * Sin;
      W := (StringGrid1.DefaultColWidth + 1) * (Colin - 1) + 31;
      StringGrid1.ScrollBars := ssNone;           // スクロールバーなし
    end
    else
    begin                                         // 固定行を含め11行より多い場合
      H := (StringGrid1.DefaultRowHeight + 1) * (10 + 1);
      W := (StringGrid1.DefaultColWidth + 1) * (Colin - 1) + 31;
//      W := (StringGrid1.DefaultColWidth + 1) * Colin;
      StringGrid1.ScrollBars := ssVertical;       // スクロールバー表示
    end;
  StringGrid1.ClientWidth := W;
  StringGrid1.ClientHeight := H;
end;

// グリッド固定行の設定
procedure TForm1.FGridSet(Sin, Colin: integer);
var
  E : integer;
begin
  GridSet(Sin, Colin);
  for E := 1 to Sin - 1 do
      StringGrid1.Rows[E].Text := intTostr(E);
  StringGrid1.Cols[1].Text := 'x';
  StringGrid1.Cols[2].Text := 'y';
end;

// 係数テーブル設定
procedure maketable(x, y : DArray; N: integer);    // 係数を求めy[]に上書き
var
  i, j : integer;
begin
  for j := 0 to N - 2 do begin
    if x[j] = x[j + 1] then begin
      application.MessageBox(pchar('x' + inttostr(j+1) + ' x' + inttostr(j+2)
                                         + 'が同じ値です。'),'注意',0);
      exit;
    end;
  end;
  for j := 0 to N - 1 do
    for i := j + 1 to N - 1 do begin
      if y[i] - y[j] = 0 then begin
        application.MessageBox(pchar('y' + inttostr(i+1) + '-y' + inttostr(j+1)
                                         + 'がゼロになります。'),'注意',0);
        exit;
      end;
      y[i] := (x[i] - x[j]) / (y[i] - y[j]);
    end;
end;

// 補間計算
function interpolate(x, y: DArray; N: integer; t: double): double;  // 補間
var
  i : integer;
  r : double;
begin
  r := y[N - 1];
  for i := N - 2 downto 0 do
    r := (t - x[i]) / r + y[i];
  result := r;
end;

// 参考値tax(x)セット
procedure TForm1.tanxBtnClick(Sender: TObject);
var
  N : integer;
  i, imax : integer;
  s, t, e, es : double;
  x, y : Darray;
begin
  N := 5;
  Nedit.Text := inttostr(N);
  GridSet(N + 1, 3);
  setlength(x, N);
  setlength(y, N);
  Series1.Clear;
  Series2.Clear;
  Series3.Clear;
  for i := 0 to N - 1 do begin
    x[i] := 20 * i;
    y[i] := tan(x[i] * pi / 180);
    Series3.AddXY(x[i], y[i]);
    StringGrid1.cells[1,i + 1] := floatTostr(x[i]);
    StringGrid1.cells[2,i + 1] := floatTostr(y[i]);
  end;
  maketable(x, y, N);                   // 表の作成
  imax := (N - 1) * 20;
  es := 1e3;
  chart1.RightAxis.Title.Text := '誤差×1E3';

  for i := 0 to imax do begin
    t := tan(i * pi / 180);
    s := interpolate(x, y, N, i);       // 補間計算
    Series1.AddXY(i, s);
    e := (s - t) * es;
    Series2.AddXY(i, e);
  end;
end;

// グリッドN数セット
procedure TForm1.NsetBtnClick(Sender: TObject);
var
  N, ch : integer;
begin
  val(Nedit.Text, N, ch);
  if ch <> 0 then begin
    application.MessageBox('N数の入力に間違いが有ります。','注意',0);
    exit;
  end;
  if N > 100 then begin
    application.MessageBox('N数は100迄にして下さい。','注意',0);
    exit;
  end;
  GridSet(N + 1, 3);
end;

// グリッドの値による補間計算
procedure TForm1.interpolationBtnClick(Sender: TObject);
var
  N, ch, i, imax : integer;
  x, y : Darray;
  cn : string;
  s, dx, xx : double;
begin
  val(Nedit.Text, N, ch);
  if ch <> 0 then begin
    application.MessageBox('N数の入力に間違いが有ります。','注意',0);
    exit;
  end;
  if N > 100 then begin
    application.MessageBox('N数は100迄にして下さい。','注意',0);
    exit;
  end;
  GridSet(N + 1, 3);
  setlength(x, N);
  setlength(y, N);
  for i := 0 to N - 1 do begin
    val(StringGrid1.cells[1,i + 1], x[i], ch);
    if ch <> 0 then begin
      cn := 'x' + intTostr(i + 1) + 'に間違いが有ります。';
      application.MessageBox(pchar(cn),'注意',0);
      break;
    end;
    val(StringGrid1.cells[2,i + 1], y[i], ch);
    if ch <> 0 then begin
      cn := 'y' + intTostr(i + 1) + 'に間違いが有ります。';
      application.MessageBox(pchar(cn),'注意',0);
      break;
    end;
  end;
  if ch <> 0 then exit;
  Series1.Clear;
  Series2.Clear;
  Series3.Clear;
  for i := 0 to N - 1 do
    Series3.AddXY(x[i], y[i]);
  maketable(x, y, N);                     // 表の作成
  imax := (N - 1) * 20;
  chart1.RightAxis.Title.Text := '';
  dx := (x[N-1] - x[0]) / imax;
  for i := 0 to imax do begin
    xx := i * dx + x[0];
    s := interpolate(x, y, N, xx);        // 補間計算
    Series1.AddXY(xx, s);
  end;
end;

// グリッド初期設定
procedure TForm1.FormCreate(Sender: TObject);
begin
  FGridSet(101, 3);                 // 固定行1列1 + 100行2列まで行列を変更しても
                                    // 入力値がクリアされないようにします。
  GridSet(4, 3);                    // 最初の設定
end;

end.
![]() continued_fraction_F_interpolation.zip
continued_fraction_F_interpolation.zip
三角関数、逆三角関数、その他関数 に戻る