パレート分布
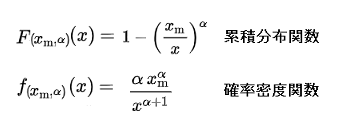
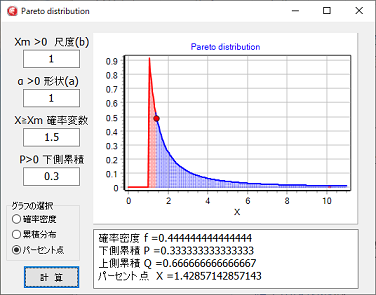
イタリアの経済学者ヴィルフレド・パレートが所得の分布をモデリングする分布とした連続型の確率分布です。
詳細については、インターネットでパレート分布を検索して下さい。


プログラム
unit Main;

interface

uses
  Winapi.Windows, Winapi.Messages, System.SysUtils, System.Variants, System.Classes, Vcl.Graphics,
  Vcl.Controls, Vcl.Forms, Vcl.Dialogs, Vcl.StdCtrls, Vcl.ExtCtrls, Vcl.Buttons,
  VclTee.TeeGDIPlus, VCLTee.Series, VCLTee.TeEngine, VCLTee.TeeProcs,
  VCLTee.Chart;

type
  TForm1 = class(TForm)
    LabeledEdit1: TLabeledEdit;
    LabeledEdit2: TLabeledEdit;
    LabeledEdit3: TLabeledEdit;
    BitBtn1: TBitBtn;
    RadioGroup1: TRadioGroup;
    Memo1: TMemo;
    LabeledEdit4: TLabeledEdit;
    Chart1: TChart;
    Series1: TLineSeries;
    Series2: TPointSeries;
    Series3: TLineSeries;
    Series4: TLineSeries;
    procedure BitBtn1Click(Sender: TObject);
  private
    { Private 宣言 }
  public
    { Public 宣言 }
  end;

var
  Form1: TForm1;

implementation

{$R *.dfm}

uses system.Math, system.UITypes;

//--------------------確率密度関数-------------------
function probability_density(x, a, xm: double): double;
begin
  if x <= xm then begin
    result := 0;
    exit;
  end;
  result := a / xm / power(x / xm, a + 1);
end;

//-------------------下側累積確率--------------------
function lower_cumulative(x, a, xm: double): double;
begin
  if x <= xm then begin
    result := 0;
    exit;
  end;
  result := 1 - power(xm / x, a);
end;

//-------------------上側累積確率--------------------
function upper_cumulative(x, a, xm: double): double;
begin
  if x <= xm then begin
    result := 1;
    exit;
  end;
  result := power(xm / x, a);
end;

//-------------------逆下側累積確率------------------
function arclower_cumulative(px, a, xm: double): double;
var
  t, s, m : double;
begin
  if px >= 1 then begin
    result := infinity;
    exit;
  end;
  t := 1 - px;
  s := power(xm, a) / t;
  m := ln(s) / a;
  result := exp(m);
end;

//----- 計算 グラフ描画-------
procedure TForm1.BitBtn1Click(Sender: TObject);
const
  n = 200;
var
  xm, a, x: double;
  i: integer;
  f, fx, vl, vu, p: double;
  min, max, dx, xi, g: double;
  col : Tcolor;
begin
  val(LabeledEdit1.Text, xm, i);
  if i <> 0 then begin
    MessageDlg('Xmの値に間違いがあります。', mtInformation,
      [mbOk], 0, mbOk);
    exit;
  end;
  if xm <= 0 then begin
    MessageDlg('Xmの値をゼロより大きくして下さい。', mtInformation,
      [mbOk], 0, mbOk);
    exit;
  end;
  val(LabeledEdit2.Text, a, i);
  if i <> 0 then begin
    MessageDlg('αの値に間違いがあります。', mtInformation,
      [mbOk], 0, mbOk);
    exit;
  end;
  if a <= 0 then begin
    MessageDlg('αの値をゼロより大きくして下さい。', mtInformation,
      [mbOk], 0, mbOk);
    exit;
  end;
  val(LabeledEdit3.Text, x, i);
  if i <> 0 then begin
    MessageDlg('Xの値に間違いがあります。', mtInformation,
      [mbOk], 0, mbOk);
    exit;
  end;
  if x < xm then begin
    MessageDlg('xの値をXmより大きくして下さい。', mtInformation,
      [mbOk], 0, mbOk);
    exit;
  end;
  val(LabeledEdit4.Text, p, i);
  if i <> 0 then begin
    MessageDlg('Pの値に間違いがあります。', mtInformation,
      [mbOk], 0, mbOk);
    exit;
  end;
  if (p < 0) or (p > 1) then begin
    MessageDlg('Pの値が範囲外です。', mtInformation,
      [mbOk], 0, mbOk);
    exit;
  end;
  // グラフバックグラウンド消去
  Chart1.BackImage.Bitmap.Width := Chart1.Width;
  Chart1.BackImage.Bitmap.Height := Chart1.Height;
  with Chart1.BackImage.Bitmap.Canvas do begin
    Brush.Color := clWhite;
    Brush.Style := bsSolid;
    FillRect(Rect(0, 0, Chart1.Width, Chart1.Height));
    Font.Size := 9;
  end;
  // 各値計算とグラフ表示
  f := probability_density(x, a, xm);
  vl := lower_cumulative(x, a, xm);
  vu := upper_cumulative(x, a, xm);
  fx := arclower_cumulative(p, a, xm);
  memo1.Clear;
  Series1.Clear;
  Series2.Clear;
  Series3.Clear;
  Series4.Clear;
  memo1.Lines.Append('確率密度 f =' + floatTostr(f));
  memo1.Lines.Append('下側累積 P =' + floatTostr(vl));
  memo1.Lines.Append('上側累積 Q =' + floatTostr(vu));
  memo1.Lines.Text := memo1.Lines.Text + 'パーセント点 X =' + floatTostr(fx);
//  memo1.Lines.Append('パーセント点 x =' + floatTostr(fx));
  min := 0;
  max := 11;
  if x > max - 1 then max := round(x + 1);
  dx := (max - min) / n;
  if RadioGroup1.ItemIndex = 0 then begin
    Series2.AddXY(x, f);
    for i := 0 to n do begin
      xi := dx * i + min;
      g := probability_density(xi, a, xm);
      Series1.AddXY(xi, g);
    end;
  end;
  if RadioGroup1.ItemIndex = 1 then begin
    Series4.LinePen.Width := 2;
    for i := 0 to n do begin
      xi := i * dx + min;
      g := lower_cumulative(xi, a, xm);
      Series3.AddXY(xi, g);
      g := upper_cumulative(xi, a, xm);
      Series1.AddXY(xi, g);
    end;
    application.ProcessMessages;
    Series4.LinePen.Width := 3;
    Series4.AddXY(x, 0,'', clBlack);
    Series4.AddXY(x, Chart1.LeftAxis.Maximum,'', clBlack);
    with Chart1.BackImage.Bitmap.Canvas do begin
      Font.Color := clRed;
      TextOut(200,100,'赤 下側累積確率');
      Font.Color := clBlue;
      TextOut(200,120,'青 上側累積確率');
    end;
  end;
  if RadioGroup1.ItemIndex = 2 then begin
    if fx > max - 1 then max := round(fx + 1);
    dx := (max - min) / n;
    Series4.LinePen.Width := 1;
    if p >= 1 then begin
      with Chart1.BackImage.Bitmap.Canvas do begin
        Font.Color := clBlack;
        TextOut(100,60,'下側累積確率 P = 1');
        TextOut(110,80,'パーセント点 x= 無限大');
        exit;
      end;
    end;
    for i := 0 to n do begin
      xi := dx * i + min;
      g := probability_density(xi, a, xm);
      if xi <= fx then col := clRed else col := clblue;
      Series1.AddXY(xi, g,'', col);
      Series4.AddXY(xi, 0,'', col);
      Series4.AddXY(xi, g,'', col);
      Series4.AddXY(xi, 0,'', col);
    end;
    g := probability_density(fx, a, xm);
    Series2.AddXY(fx, g);
  end;
end;

end.
一般化パレート分布
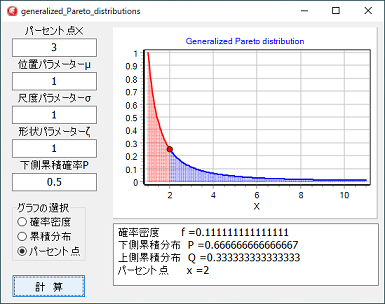
確率変数Xが設定された閾値を超える確率(P>α)を推定する場合のモデルとして使用。
位置母数μ、尺度母数σ、形状母数ζの三個のパラメーターからなります。

累積分布 Fx の値から パーセント点Xの計算
t = -1 / ζ
t√(1-Fx)
= 1 + (ζx-ζμ)/σ
m = t√(1-Fx) =
exp(log(1-Fx)/t)
x = (m-1)σ / ζ + μ

プログラム
unit Main;

interface

uses
  Winapi.Windows, Winapi.Messages, System.SysUtils, System.Variants, System.Classes, Vcl.Graphics,
  Vcl.Controls, Vcl.Forms, Vcl.Dialogs, Vcl.StdCtrls, Vcl.Buttons, Vcl.ExtCtrls, system.UITypes,
  VclTee.TeeGDIPlus, VCLTee.Series, VCLTee.TeEngine, VCLTee.TeeProcs,
  VCLTee.Chart;

type
  TForm1 = class(TForm)
    LabeledEdit1: TLabeledEdit;
    LabeledEdit2: TLabeledEdit;
    LabeledEdit3: TLabeledEdit;
    LabeledEdit4: TLabeledEdit;
    BitBtn1: TBitBtn;
    Memo1: TMemo;
    LabeledEdit5: TLabeledEdit;
    Chart1: TChart;
    Series1: TLineSeries;
    Series2: TPointSeries;
    Series3: TLineSeries;
    Series4: TLineSeries;
    RadioGroup1: TRadioGroup;
    procedure FormCreate(Sender: TObject);
    procedure BitBtn1Click(Sender: TObject);
  private
    { Private 宣言 }
  public
    { Public 宣言 }
  end;

var
  Form1: TForm1;

implementation

{$R *.dfm}

uses System.Math;

// 確率密度関数
function probability_density(x, u, s, z: double): double;
var
  p : double;
begin
  if s = 0 then begin         // 演算不可
    result := infinity;
    exit;
  end;
  if z = 0 then begin
    result := exp((u - x) / s) / s;
    exit;
  end;
  p := -1 / z - 1;
  result := power((1 + z * (x - u) / s), p) / s;
end;

// 下側累積分布関数      (下側累積確率)
function lower_cumulative_distribution(x, u, s, z: double): double;
var
  p : double;
begin
  if s = 0 then begin         // 演算不可
    result := 0;
    exit;
  end;
  if z = 0 then begin
    result := 1- exp((u - x) / s);
    exit;
  end;
  p := -1 / z;
  result := 1 - power((1 + z * (x - u) / s), p);
end;

// 上側累積分布関数      (上側累積確率)
function upper_cumulative_distribution(x, u, s, z: double): double;
var
  p : double;
begin
  if s = 0 then begin         // 演算不可
    result := 1;
    exit;
  end;
  if z = 0 then begin
    result := exp((u - x) / s);
    exit;
  end;
  p := -1 / z;
  result := power((1 + z * (x - u) / s), p);
end;

// 逆下側累積分布関数
function arc_lower_cumulative_distribution(px, u, s, z: double): double;
var
  m : double;
begin
  if px = 1 then begin        // 演算不可
    result := infinity;
    exit;
  end;
  m := exp(-z * ln(1 - px));   // m = -z√(1-px)
  if z = 0 then               // z = 0 演算不可
    result := u
  else
    result := (m - 1) * s / z + u;
end;

procedure TForm1.BitBtn1Click(Sender: TObject);
const
  n = 200;
var
  ch, i : integer;
  x, u, s, z, xp : double;
  f, p, q, px : double;
  dx, xi, g : double;
  min, max : double;
  col: Tcolor;
begin
  val(LabeledEdit1.Text, x, ch);
  if ch <> 0 then begin
    MessageDlg('Xの値に間違いがあります。', mtInformation,
      [mbOk], 0, mbOk);
    exit;
  end;
  val(LabeledEdit2.Text, u, ch);
  if ch <> 0 then begin
    MessageDlg('μの値に間違いがあります。', mtInformation,
      [mbOk], 0, mbOk);
    exit;
  end;
  val(LabeledEdit3.Text, s, ch);
  if ch <> 0 then begin
    MessageDlg('σの値に間違いがあります。', mtInformation,
      [mbOk], 0, mbOk);
    exit;
  end;
  if s < 0 then begin
    MessageDlg('σのはゼロ以上にして下さい。', mtInformation,
      [mbOk], 0, mbOk);
    exit;
  end;
  val(LabeledEdit4.Text, z, ch);
  if ch <> 0 then begin
    MessageDlg('ζの値に間違いがあります。', mtInformation,
      [mbOk], 0, mbOk);
    exit;
  end;
  val(LabeledEdit5.Text, px, ch);
  if ch <> 0 then begin
    MessageDlg('Pの値に間違いがあります。', mtInformation,
      [mbOk], 0, mbOk);
    exit;
  end;
  if x < u then begin
    MessageDlg('Xのはμ以上にして下さい。', mtInformation,
      [mbOk], 0, mbOk);
    exit;
  end;
  f := probability_density(x, u, s, z);
  p := lower_cumulative_distribution(x, u, s, z);
  q := upper_cumulative_distribution(x, u, s, z);
  xp := arc_lower_cumulative_distribution(px, u, s, z);
  memo1.Clear;
  memo1.Lines.Append('確率密度   f =' + floatTostr(f));
  memo1.Lines.Append('下側累積分布 P =' + floatTostr(p));
  memo1.Lines.Append('上側累積分布 Q =' + floatTostr(q));
  if s > 0 then
    memo1.Lines.Text := memo1.Lines.Text + 'パーセント点   x =' + floatTostr(xp)
  else
    memo1.Lines.Text := memo1.Lines.Text + 'パーセント点   答え無し';
//  memo1.Lines.Append('x =' + floatTostr(xp));

  // グラフバックグラウンド消去
  Chart1.BackImage.Bitmap.Width := Chart1.Width;
  Chart1.BackImage.Bitmap.Height := Chart1.Height;
  with Chart1.BackImage.Bitmap.Canvas do begin
    Brush.Color := clWhite;
    Brush.Style := bsSolid;
    FillRect(Rect(0, 0, Chart1.Width, Chart1.Height));
    Font.Size := 9;
  end;
  // 各値計算とグラフ表示
  Series1.Clear;
  Series2.Clear;
  Series3.Clear;
  Series4.Clear;
  min := u;
  max := 11;
  if x > max - 1 then max := round(x + 1);
  dx := (max - min) / n;
  if s > 0 then
    if RadioGroup1.ItemIndex = 0 then begin
      Series2.AddXY(x, f);
      for i := 0 to n do begin
        xi := dx * i + min;
        g := probability_density(xi, u, s, z);
        Series1.AddXY(xi, g);
      end;
    end;
  if RadioGroup1.ItemIndex = 1 then begin
    Series4.LinePen.Width := 2;
    for i := 0 to n do begin
      xi := i * dx + min;
      g := lower_cumulative_distribution(xi, u, s, z);
      Series3.AddXY(xi, g);
      g := upper_cumulative_distribution(xi, u, s, z);
      Series1.AddXY(xi, g);
    end;
    application.ProcessMessages;
    Series4.LinePen.Width := 3;
    Series4.AddXY(x, 0,'', clBlack);
    Series4.AddXY(x, Chart1.LeftAxis.Maximum,'', clBlack);
    with Chart1.BackImage.Bitmap.Canvas do begin
      Font.Color := clRed;
      TextOut(200,100,'赤 下側累積確率');
      Font.Color := clBlue;
      TextOut(200,120,'青 上側累積確率');
    end;
  end;
  if s > 0 then
    if RadioGroup1.ItemIndex = 2 then begin
      if (xp > max - 1) and (xp < maxsingle) then max := round(xp + 1);
      dx := (max - min) / n;
      Series4.LinePen.Width := 1;
      if px >= 1 then begin
        with Chart1.BackImage.Bitmap.Canvas do begin
          Font.Color := clBlack;
          TextOut(100,60,'下側累積確率 P = 1');
          TextOut(110,80,'パーセント点 x= 無限大');
          exit;
        end;
      end;
      if s > 0 then
        for i := 0 to n do begin
          xi := dx * i + min;
          g := probability_density(xi, u, s, z);
          if g > maxsingle then g := maxsingle;
          if xi <= xp then col := clRed else col := clblue;
          Series1.AddXY(xi, g,'', col);
          Series4.AddXY(xi, 0,'', col);
          Series4.AddXY(xi, g,'', col);
          Series4.AddXY(xi, 0,'', col);
        end;
        g := probability_density(xp, u, s, z);
        Series2.AddXY(xp, g);
    end;
  if (s = 0) and (RadioGroup1.ItemIndex <> 1) then
    with Chart1.BackImage.Bitmap.Canvas do begin
      Font.Color := clRed;
      TextOut(150,100,'全て infinity グラフ無し');
    end;
end;

procedure TForm1.FormCreate(Sender: TObject);
begin
  memo1.Clear;
  memo1.Lines.Append('一般化パレート分布');
end;

end.